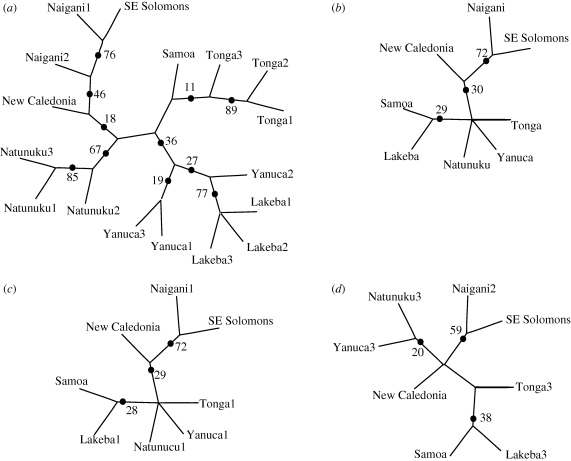
Figure 4.
Consensus cladograms (50% majority rule) produced through cladistic analysis of the matrix in table 2. Numbers indicate the frequency of clades defined by the dot appearing in 10 000 replicate matrices. Clades without dots appear at less than 5% frequency in replicate matrices. (a) All assemblages divided by time periods, (b) all assemblages collapsed into single time period, (c) early assemblages and those that are not divided into periods, (d) late assemblages and those that are not divided into periods.

