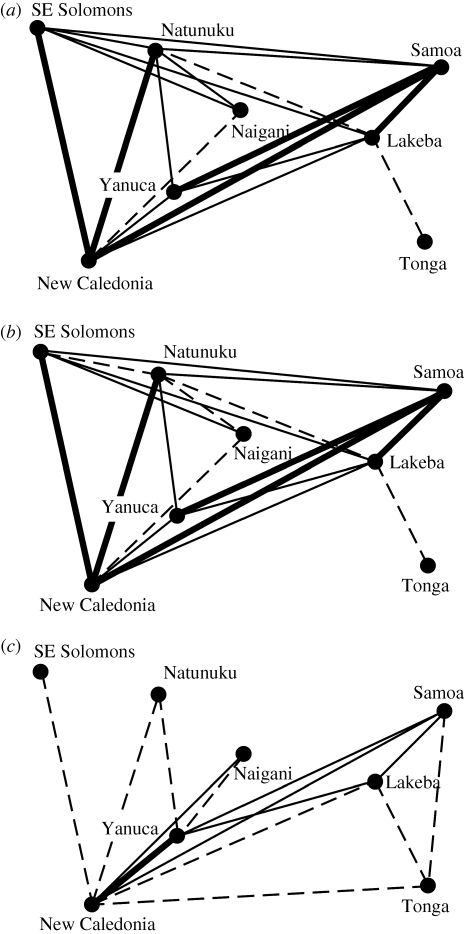
Figure 6.
Mini-max graphs showing assemblages and edges of the highest Hamming distance or less required to connect all assemblages to the graph. Node positions are a schematic of geographical positions. Edges are grouped into three categories: dashed for highest Hamming distance (i.e. least similar), solid-thin for medium Hamming distance and solid-thick for lowest Hamming distance (i.e. most similar). Bin ranges for these categories were determined by generating a histogram of all Hamming distance scores with three bins and testing the fit of this distribution to a normal distribution (via Kolmogorov–Smirnov test). (a) All assemblages are collapsed into a single time period; (b) early assemblages and those that are not divided into periods; (c) late assemblages and those that are not divided into periods.

