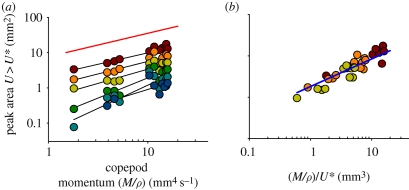
Figure 4.
Peak areas with induced flow velocities exceeding threshold velocities (U*) as a function of (a) the density-specific momentum of the copepod or (b) the specific momentum normalized by the threshold velocity. Individual regression lines have been plotted in (a), and a regression including only threshold velocities of 1–3 mm s−1 and forced with a slope of 2/3 have been computed in (b). This regression is log (area, mm2) = log (1.815) + (2/3) × log (M/ρU*, mm3); R2 = 0.83. Only jumps where the entire imposed flow field was within the field of view are included (n = 12). Orange line, slope 2/3; blue line, regression. Colours of circles represent U* values as defined in the legend to figure 3 above.

