Figure 3.
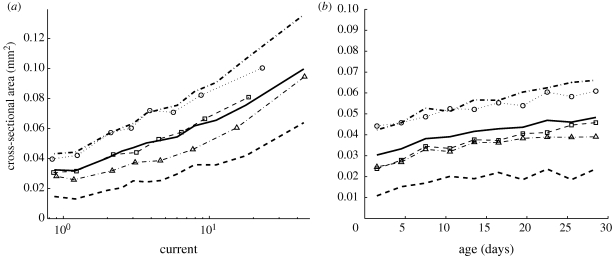
Correlation between cord cross-sectional area and (a) the current predicted by the uniform model or (b) cord age. Both graphs indicate the mean over all networks (thick solid line), and first and third quartiles over all networks (thick dashed line). Other markers indicate the mean values for individual experiments. (a) There was a positive correlation between cross-sectional area and the current in a cord, where current is calculated by applying a unit current to each tip, and we assume constant conductance per unit length. The graph was produced by taking data from all time steps and partitioning it into bins. The first data point marks the mean cross-sectional area for cords with a current of one or less (as was the case for 30% of cords), while the second marks the mean cross-sectional area for cords with a current between one and two (as was the case for 25% of cords). The remaining cords were partitioned into bins of equal size according to the calculated current, and each data point marks the mean current and mean area of one of these bins. (b) Although most cords thicken over time, there was only a weak correlation between the age of a cord and its cross-sectional area. Note that the difference in values on the y-axis between young and old edges is small compared with the spread within each age group. Current is a better predictor of cross-sectional area.

