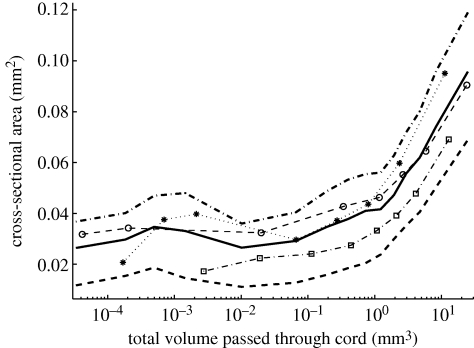
Figure 5.
Correlation between cross-sectional area and the total volume to pass through each cord. The data from all experiments and all time steps were partitioned into bins according to the total volume of fluid that had passed through each cord over its history up to each time point. The mean area (thick solid line) and first and third quartile values (thick dashed lines) have been plotted for each bin. The other markers indicate the means for individual experiments.

