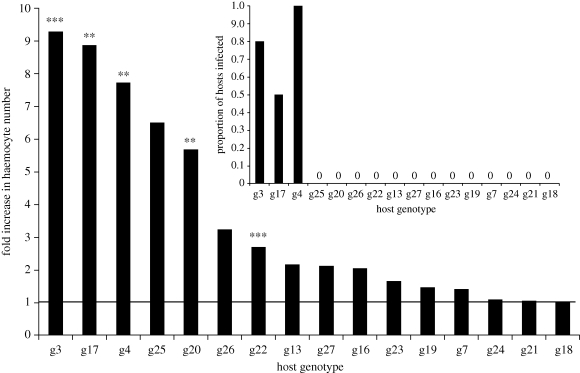
Figure 3.
Fold induction of haemocyte numbers in P. ramosa-exposed D. magna (n = 6, each replicate consists of five Daphnia), relative to unexposed D. magna (n = 6, each replicate consists of five Daphnia). The bold line at y = 1 shows the uninduced (basal) level. The inset shows the proportion of individuals that became infected in P. ramosa-exposed treatments in each genotype (n = 12, each replicate consists of an individual Daphnia). Asterisks indicate if haemocyte numbers rose significantly (after sequential Bonferroni adjustment) above basal levels: ** p < 0.01, *** p < 0.001.

