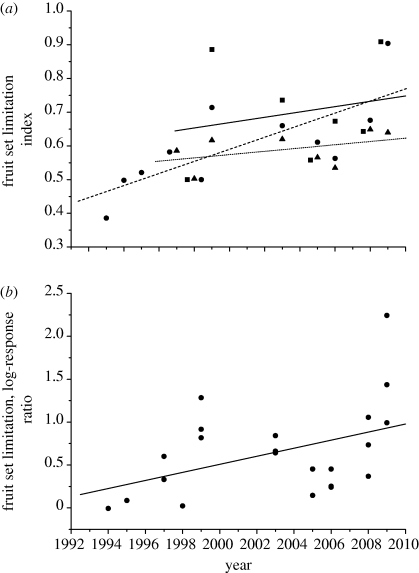
Figure 5.
Temporal trends in the degree of pollination limitation over the course of the study. (a) Indices of pollen limitation for supplementation experiments done in the early, middle or late portions of the flowering period are indicated by squares, circles and triangles, respectively. Symbols that overlapped have been offset horizontally. Simple linear regression lines are presented to indicate trends within each dataset (early, solid; middle, long dash; late, short dash). These graphs include points from 1993 and 1998 experiments with such heavy frost damage that few or no fruits were produced in either treatment. These points are excluded from the analyses of significance (see text and table 4). (b) As above, but the data have been transformed to log-response ratios, the problematic 1993 and 1998 data removed and the early and late datasets rescaled by factors representing the average differences among the three temporal supplementation experiments within years. This allows an overall test of the hypothesis that pollination service has deteriorated over the study period (r = 0.434, n = 23, p = 0.039).

