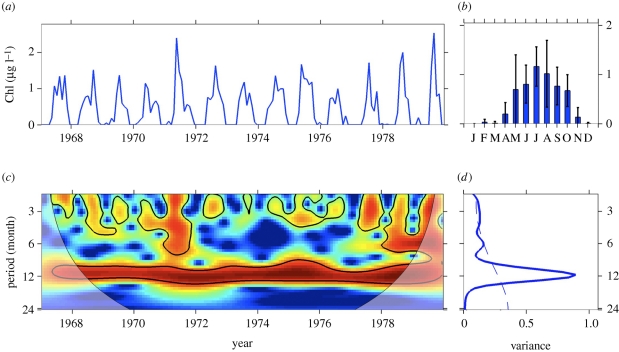
Figure 1.
Wavelet analysis for the characterization of periodic frequencies of the North Atlantic Chl-a time series (57–62° N, 20–10° W) from 1967 to 1979. (a) Series of the Chl-a data, (b) monthly averages (± s.d.) over the sampling period, (c) continuous wavelet power spectrum showing the periodicity (shaded area indicates the region of time and frequency affected by the edges of the data and should not be considered; solid lines are significant (p < 0.05) coherent time–frequency regions) and (d) time-averaged wavelet spectrum of the series showing the dominance of the periods (dashed line shows the 95% significance level). Both the continuous and the time-averaged wavelet power spectra are shown in the base 2 logarithm. The continuous wavelet spectrum illustrates how the strength of the periodicities changed over time; colours indicate differing degrees of variance (dark red indicates high intensity; dark blue indicates low intensity). The time-averaged spectrum depicts the periods that explain a high proportion of the temporal variance of the series (y-axis) and the recurrence strength of the periods (x-axis). David Johns supplied data for the Chl-a time series as recorded by the Continuous Plankton Recorder green index, Sir Alister Hardy Foundation for Ocean Science, Plymouth (http://www.sahfos.org).

