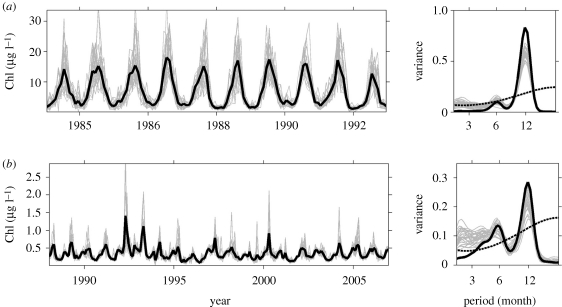
Figure 2.
Comparison of monthly time series and periodicity of Chl-a based on daily data (thick black line) and simulated monthly sampling (thin grey lines). For each series (a,b), the left panel shows the Chl-a series and the right panel the time-averaged wavelet spectrum of the series showing the dominance of the periods (dashed line shows the 95% significance level of the actual data based on daily sampling). The Chl-a series are from (a) North Inlet Estuary (site OL), 1983–1992; (b) Gulf of Aqaba (Eilat), 1988–2006. Data are provided by (a) http://links.baruch.sc.edu/Data/CoastalData.html and (b) Amatzia Genin (Steinitz Marine Biology Laboratory, The Hebrew University).

