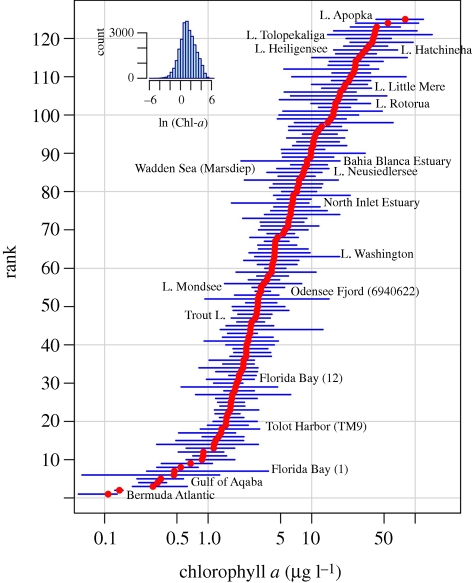
Figure 3.
Median (filled dots) and range (bars) of the annual mean phytoplankton biomass (Chl-a) at 70 estuarine–coastal sites, 50 lakes and five ocean sites. Sites are ordered by their medians and described in the electronic supplementary material, table S1. Although the length of the records varied (from 8 to 50 years) there was no relationship between the length of the dataset and the coefficient of variation of annual mean Chl-a (R2 = 0.01, p = 0.19). The insert shows the frequency distribution of log-transformed monthly Chl-a values across all sites. L. = Lake.

