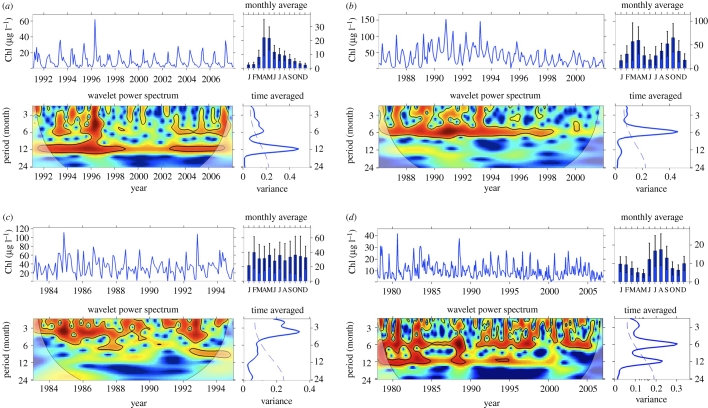
Figure 4.
Four examples of Chl-a series that illustrate common annual patterns of variability. For each series (a–d), the top left panel shows the Chl-a series, the top right monthly averages (± standard variation), bottom left the continuous wavelet power spectrum, and bottom right panel the time-averaged wavelet spectrum. The Chl-a series are from (a) Wadden Sea (Marsdiep nord), 1991–2007; (b) Lake Heiligensee, 1986–2001; (c) Lake Hatchineha, 1983–1994 and (d) Bahia Blanca Estuary (site Cuatreros), 1978–2006 (the years 1985 and 1986 were interpolated to obtain a continuous time series). See figure 1 for further information on wavelet spectra. The series were normalized so the explained variances of the time-averaged spectra can be compared across sites. Data are provided by (a) Jacco Kromkamp (http://www.waterbase.nl), (b) Rita Adrian (Leibniz-Institute of Freshwater and Inland Fisheries), (c) Karl Havens (UF/IFAS Fisheries and Aquatic Sciences) and (d) Hugo Freije (Universidad Nacional del Sur).

