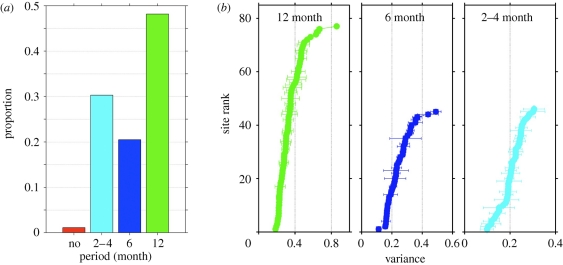
Figure 5.
Dominant periodicities and recurrence strength of phytoplankton biomass (Chl-a) patterns. (a) Proportion of dominant periodicities over all estuarine–coastal, lake and oceanic sites. (b) Strength of the recurrence pattern of the 12-, 6-, and 2–4-month periodicities. Horizontal bars show the mean (± s.d.) of the 10-year sliding bootstrap window.

