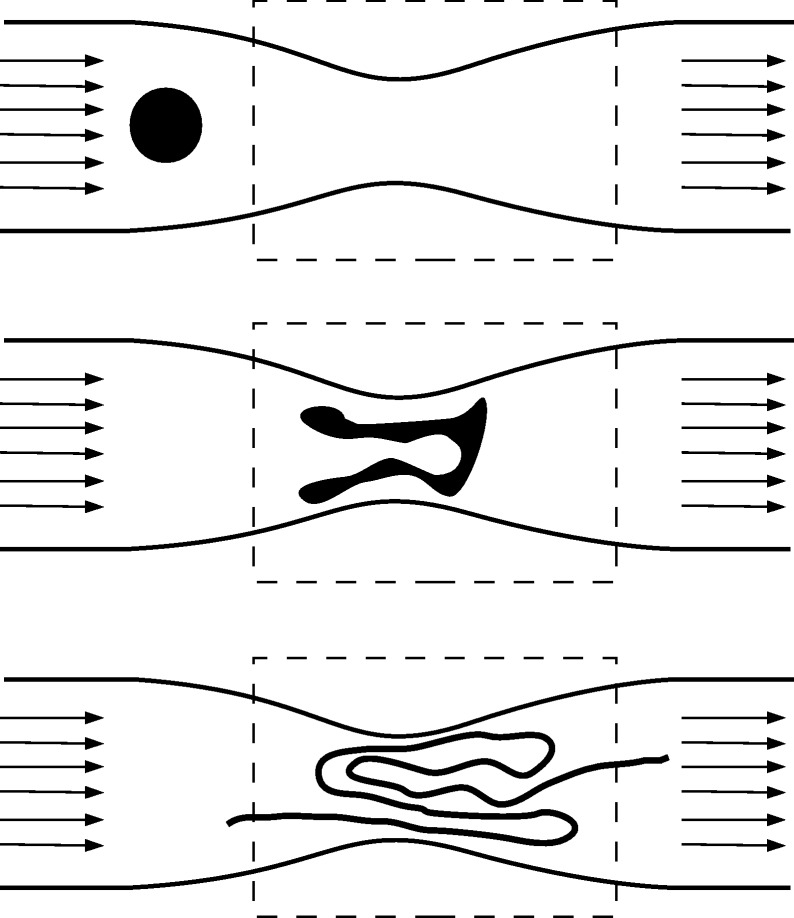
Figure 1.
Illustration of the unstable foliation: the schematic diagram shows the time evolution of a dye droplet that enters the region of observation (region inside the dashed rectangle). With time, the droplet deforms, by stretching and folding processes, and, after a long period, traces out the unstable manifold of the chaotic saddle.

