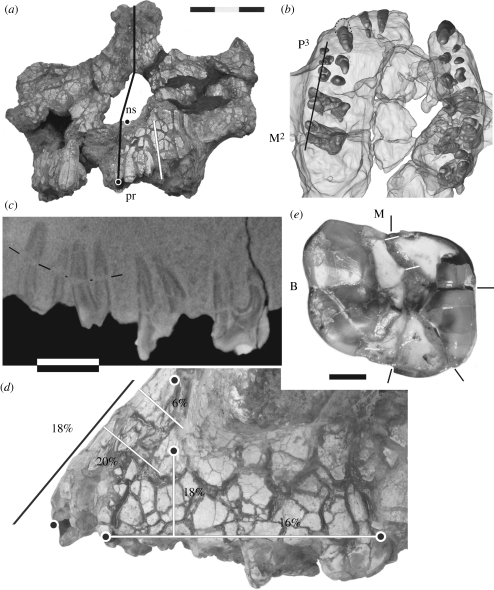
Figure 2.
Distortion of KNM-WT 40000. (a) Anterior view, giving the midline (black line) to indicate the midface skewing, left nasospinale (ns), prosthion (pr) and the trajectory used to calculate the height expansion of the subnasal area (white line). (b) CT-based 3D reconstruction of the maxilla in superior view, showing the tooth roots inside the translucent bone. (c) A high-resolution sagittal CT image through the buccal roots of the left P3 to M2 (orientation indicated by the black line in (b)). The thin black lines mark a longer crack through the premolar roots. (d) Lateral view of the left maxilla, showing the pattern of matrix-filled cracks highlighted by wetting with acetone. The five landmarks are shown as in figure 1. The trajectories along which crack widths were measured are given by lines with associated percentages of expansion (black line refers to the subnasal trajectory shown in (a)). (e) The right M2 crown (M, mesial; B, buccal), with black lines marking the endpoint of cracks highlighted with acetone. The white lines indicate the match at the mesial end of the widest crack. The dark area on the mesiolingual corner is a strong shadow of the enamel more distally, rather than damage to the dentine. Scale bars, (a,b) 30 mm, (c,d) 10 mm and (e) 3 mm.

