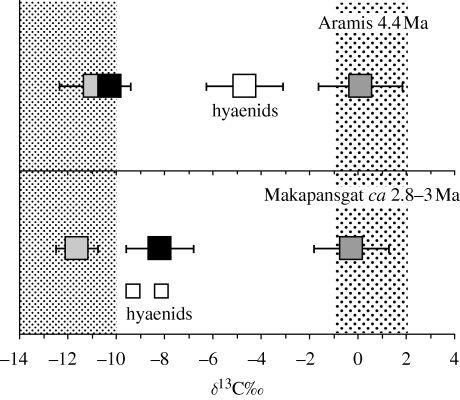
Figure 3.
A summary comparison of the hominin data for Aramis (above), and Makapansgat (below), plotted as means (black boxes) and standard deviations with mean values for C3 and C4 feeders shown for comparison. Data for carnivores (hyaenids) are also shown (white boxes; n = 2 for Makapansgat), because they are effectively integrators for the values of all the fauna they consume. These data are shifted towards values more enriched in 13C in Aramis, suggesting more open, C4 elements in the environment compared with Makapansgat, where the faunal assemblage consists largely of C3 feeders. In spite of this difference, Ar. ramidus remains relatively depleted in 13C, quite unlike the patterns for A. africanus seen at Makapansgat. Data for Aramis are from White et al. (2009b), and for Makapansgat are from Sponheimer (1999).

