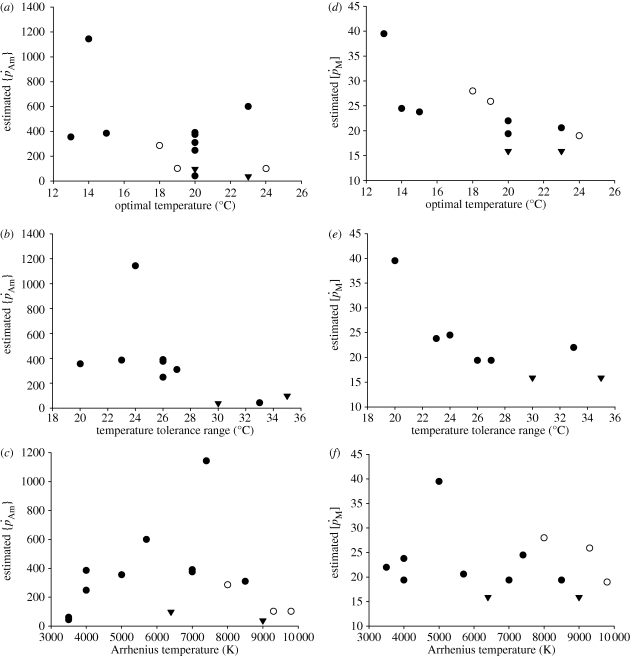
Figure 5.
Relationships between, respectively, maximum surface-area-specific assimilation rate  (a–c) and maximum volume-specific somatic maintenance rate
  (d–f), at 10°C, with optimal temperature (°C) (a,d), temperature tolerance range (°C) (b,e) and Arrhenius temperature (K) (c,f). DEB parameter values from set I. Filled circles, demersal fish; open circles, pelagic fish; filled inverted triangles, crustaceans.

