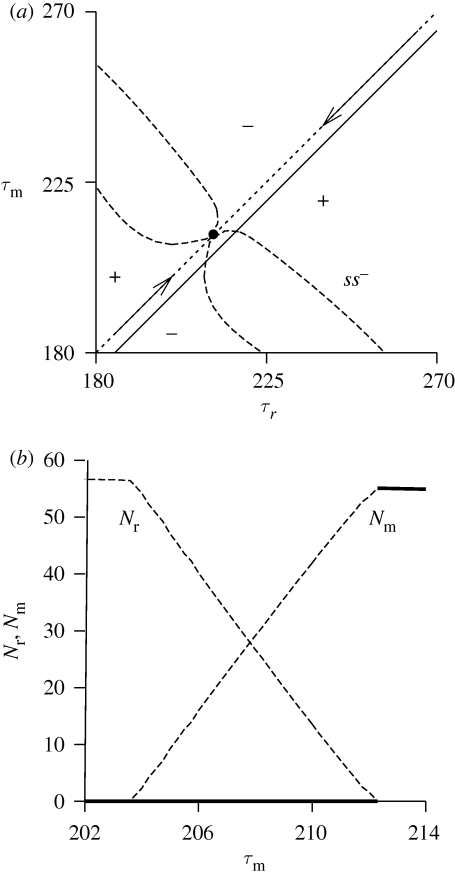
Figure 4.
(a) Detail of figure 3b around the point ss−. The drawn line is τr = τm + 5. (b) Population densities of resident (Nr = ∑i=12 Nr,i) and mutant (Nm = ∑i=12 Nm,i) populations as a function of the trait τm where τr = τm + 5. Solid lines denote the stable fixed points and dashed lines the unstable fixed points.

