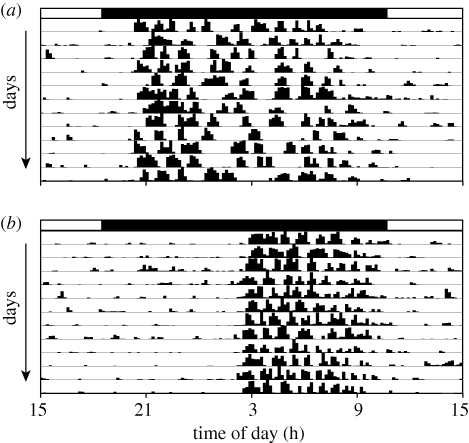
Figure 1.
Representative locomotor activity records for a circadian responder [(a) min. ETV = 97] and nonresponder [(b) min. ETV = 580] from Eq + 6. Hatch marks along each horizontal line represent the amount of activity; each horizontal line represents 24 h, and consecutive days are plotted from top to bottom. The dark phase (18.30 to 10.44 PST) is denoted by the black bar above each actogram.

