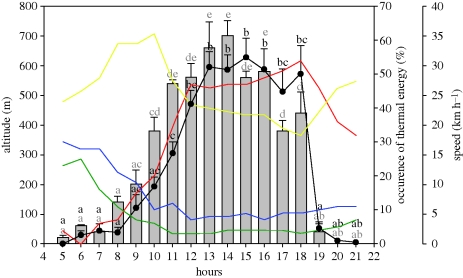
Figure 5.
Hourly variations of two flight parameters (means of speed and altitude) for the three black storks tagged with GPS PTT. The statistical analysis is processed independently for migration speed and flight speed. Different letters indicate that the hourly data of migration speed are significantly different after ANOVA (same presentation for data of flight altitude). Four classes of thermal energy, numbered from the lowest (1) to the highest (4), are shown by coloured solid lines. Red line, 4; yellow line, 3; blue line, 2; green line, 1. Grey bars, speed; black line with filled circles, altitude.

