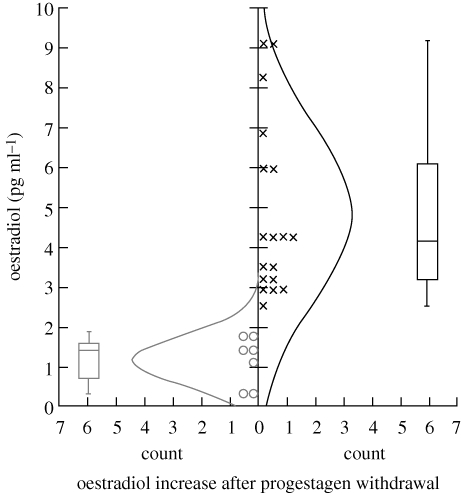
Figure 2.
Box-and-whisker diagram for plasma oestradiol concentrations in hinds at the time of presumed oestrus i.e. immediately after the playback experiment. Hinds showing a significant increase in oestradiol concentrations after sponge removal were considered to be in oestrus (cross), while those not showing this increase (open circle) were removed from the behavioural analyses.

