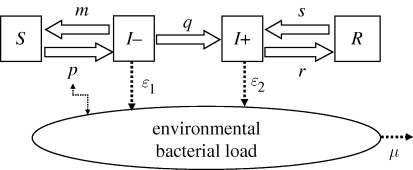
Figure 1.
Flow diagram describing the modelled spread of C. burnetii within a cattle herd. The health states are: S, non-shedder cow without antibodies; I − , shedder cow without any antibodies; I + , shedder cow with antibodies and R, non-shedder cow with antibodies. The model parameters are: p, the probability of infection or re-infection (equal to 1 − exp(−E) with E the environmental bacterial load); m, the probability of transition from I − to S; q, the probability of transition from I − to I + ; r, the probability of transition from I + to R; s, the probability of transition from R to I + ; ɛ1 and ɛ2, the quantities of bacteria shed during a time step by an individual I − and I + respectively, and μ, the mortality rate of C. burnetii in the environment.

