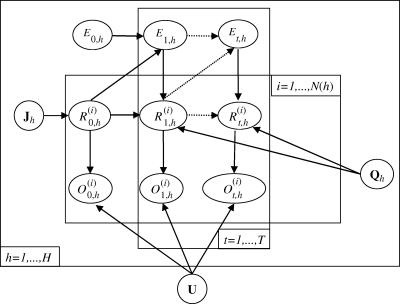
Figure 2.
Network describing the temporal evolution of individual health states of animals within an infected dairy cattle herd.  represents the real and non-observed health state of individual i belonging to herd h (i ∈ {1, … N(h)} with N(h) the total number of cows in the herd h, h ∈ {1, … H} and H the number of herds) at time t (t ∈ {0, … T)} with t28 = T and t0 = 0). Et,h describes the quantity of bacteria in the environment of the herd h at time t.
  represents the observed health state associated with
  . Jh is the probability distribution of the initial real health states in the herd h and U is the matrix of the uncertainty parameters (Se and Sp of tests) linking real and observed health states.
  contains the parameters of transitions between real health states in herd h except those characterizing the S↔I− transitions.
  is a 3 × 4 matrix corresponding to the last three rows of matrix
  described in equation (3.1).

