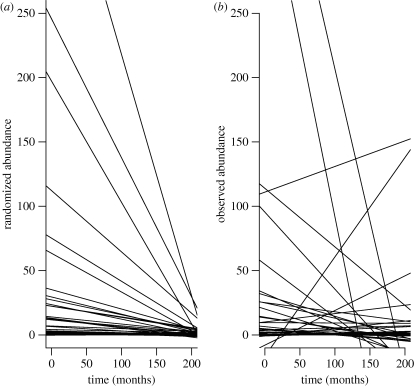
Figure 2.
Observed and simulated trend lines for the stream fish data of Grossman et al. (1982). (a) Results of a single replicate of the null model simulation, in which total abundances for each species are sampled randomly from the abundance distribution of all species pooled through time. See text for details of the simulation model. Each line is the least-squares regression for one of the simulated species. (b) Same graph for the observed data.

