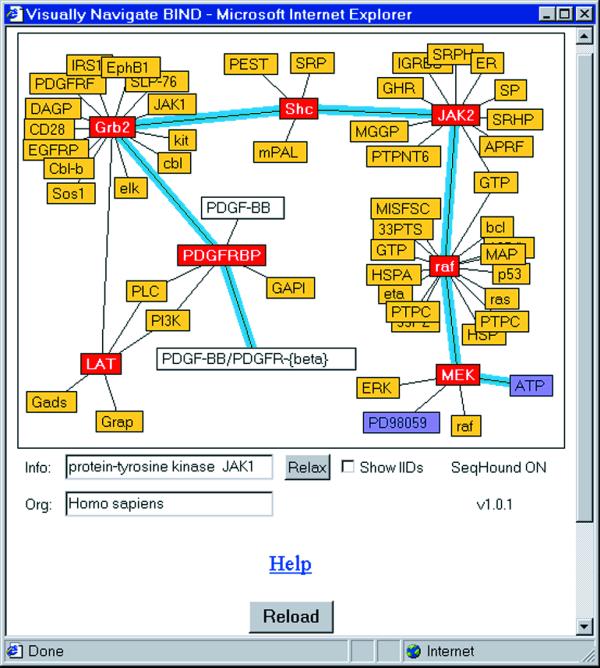
Figure 1.

BIND Interaction Viewer Java applet showing how molecules can be connected in the database from molecular complex to small molecule. Yellow, protein; purple, small molecule; white, molecular complex; red, a square is fixed in place and will not be moved by the graph layout algorithm. This session was seeded by the interaction between human LAT and Grb2 proteins involved in cell signaling in the T-cell.
