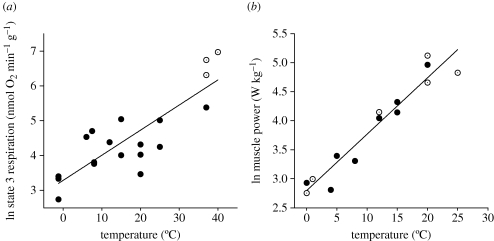
Figure 2.
Temperature and physiology, comparing species adapted to live at different environmental temperatures. (a) Relationship between mitochondrial power generation, measured as state 3 respiration rates (nmol O2 min−1 g liver fresh mass−1), and temperature. Data plotted separately for ectotherms (filled circles) and endotherms (open circles). (b) Fish muscle mass-specific power output as a function of habitat temperature. Open circles are data from measurement of muscle performance in fast-starts, closed circles are data from work-loop studies of isolated fibres. All data are for glycolytic (anaerobic) fibres; original data from Wakeling & Johnston (1998). Redrawn from Clarke & Pörtner (in press).

