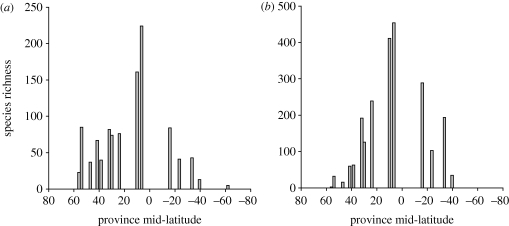
Figure 3.
Latitudinal variation in the species richness of two groups of decapods. Data are pooled by faunal province, and the species richness of each province is plotted as a function of the mid-latitude of that province. Data replotted, with permission, from Boschi (2000). (a) Carideans (shrimps and prawns). (b) Brachyurans ( true crabs).

