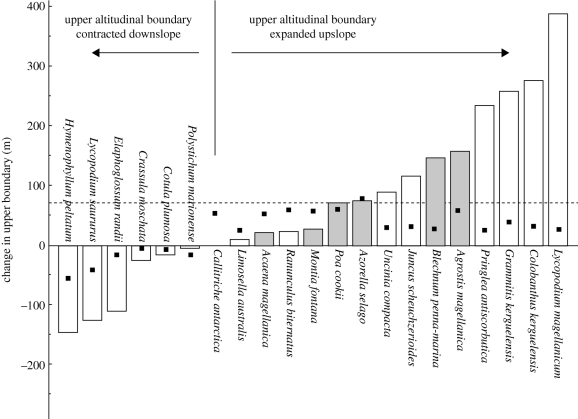
Figure 4.
Changes in the upper altitudinal limit of the indigenous vascular flora of sub-Antarctic Marion Island between 1966 and 2006 indicated by the bars (filled bars indicate those species that dominate vascular plant biomass). The points indicate a simulated range boundary change of 10% of the altitudinal range in 1966, whereas the bars show the actual change. Redrawn from le Roux & McGeoch (2008).

