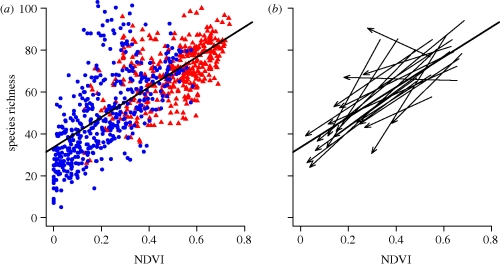
Figure 2.
(a) Spatial variation in avian richness as a function of the normalized difference vegetation index (NDVI) in both the summer (red triangles) and winter (blue circles). (b) Seasonal variation in avian richness as a function of NDVI for 20 randomly selected sites from (a). Each arrow links the richness and NDVI of a site during the breeding season to the richness and NDVI of that site during the winter. The solid black line in both plots is the linear regression through all points in (a). Note that the majority of sites have seasonal trajectories parallel to this spatial trend. Data from Hurlbert & Haskell (2003).

