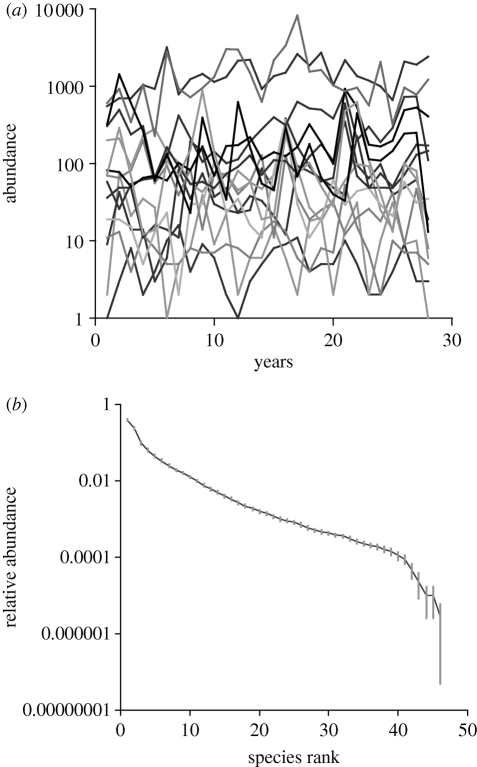
Figure 2.
(a) Temporal variation in the abundance of the 15 species that are present in every year of the time series; (b) rank abundance plot where values for first-ranked species disregarding species identity, second-ranked species, third-ranked species, etc. have been averaged across the time series. Grey bars show the 95% confidence limits around these mean values.

