Figure 1.
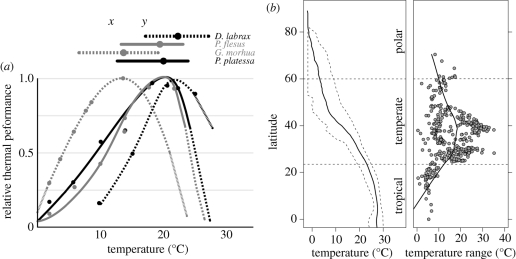
(a) Laboratory-based thermal performance profiles for North Sea demersal fishes Pleuronectes platessa (black solid line), Pleuronectes flesus (grey solid line), Gadus morhua (grey dotted line) and Dicentrarchus labrax (black dotted line). Relative performance profiles include temperature performance breadths (>69% performance; top horizontal lines) and varying tolerance ranges (solid/dotted curves). Communities assembled at temperature x will have a different composition from communities at temperature y because of diversity in thermal performance, although performance breadth is likely to be narrower in situ. Data from Freitas et al. (2007). (b) Average Northern Hemisphere sea-surface temperatures (solid line, left panel) with 95% quantile range (of 365 days per 1° latitude–longitude grid cell; dashed lines, left panel) from the 2009 HadISST1 dataset (Rayner et al. 2003) alongside seasonal temperature ranges (max–min; grey circles, right panel) from National Oceanic and Atmospheric Administration buoy data (http://www.ndbc.noaa.gov), both by latitude. Buoy data includes a local average line (solid line, right panel) based on the default Loess.smooth function in R.

