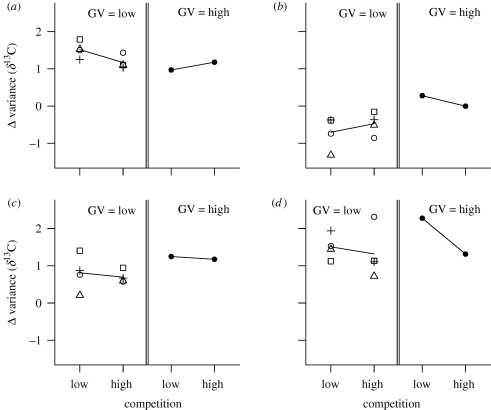
Figure 3.
Temporal change in among-individual variance in resource use of populations. Each data point is the average value of among-individual variance in resource use of two replicate populations with a specific strain combination and treatment. Symbols and panel information are as in figure 2.

