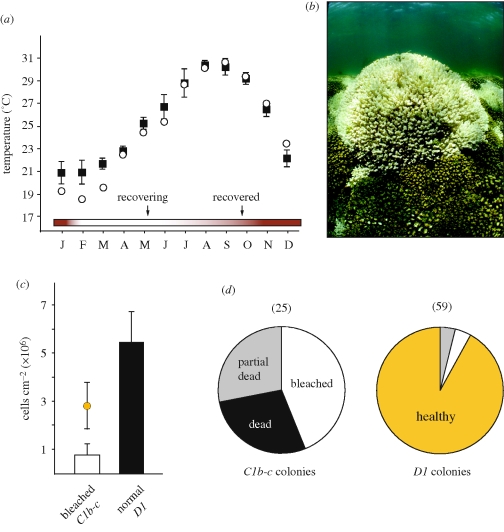
Figure 1.
Recent coral ‘bleaching’ and mortality in the Gulf of California caused by low-water temperatures. (a) Average monthly SSTs for the southern Gulf of California between 2003 and 2007 (black squares) relative to temperatures in 2008 (open circles). The brown and white colour shaded bar at the bottom of the graph indicates the period when colonies bleached and recovered, respectively, and arrows indicate approximate sampling times. (b) A large bleached colony of Pocillopora photographed in May 2008 is surrounded by unbleached colonies in the Gulf of California. (c) Average symbiont cell densities in colonies harbouring either Symbiodinium ‘C1b-c’ or ‘D1’ sampled in May 2008. The coloured circle above the mean value calculated for bleached colonies is the average cell density in colonies harbouring ‘C1b-c’ under normal conditions. Error bars represent 1 s.d. (d) Percentage of Pocillopora colonies harbouring either Symbiodinium ‘C1b-c’ or ‘D1’ that were healthy, bleached, partially dead or entirely dead. The numbers in parentheses above the pie graphs indicate the total number of permanently tagged colonies whose symbiont has been monitored since 2006.

