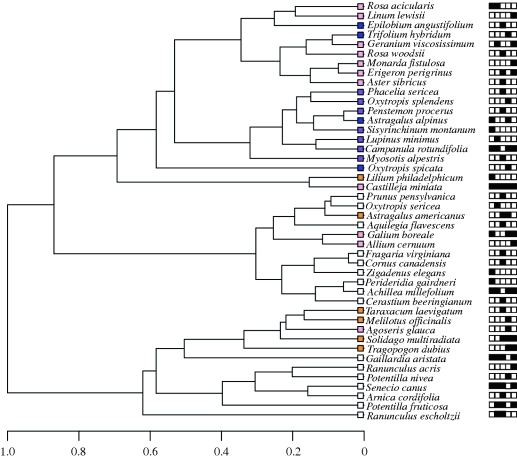
Figure 1.
Hierarchical cluster dendrogram based on the reflectance spectra for all 44 flowering species found in the five communities representing the regional colour distribution used in the analysis, showing general clustering according to the human visual spectrum. Coloured squares represent the PC1 scores of the species, matched approximately to our human perception of colour. PC1 separates white/yellow flowers from those reflecting increasing amounts of purple–UV wavelengths and represented approximately 72% of the variance in colour reflectance. PC1 scores matched approximately to our human perception of colour unless the species reflected UV wavelengths. Black squares represent the community presence matrix for all sites 1–5 (order key for squares: 1st = BHM, 2nd =HJN, 3rd = MCA, 4th =MTA and 5th = SBM).

