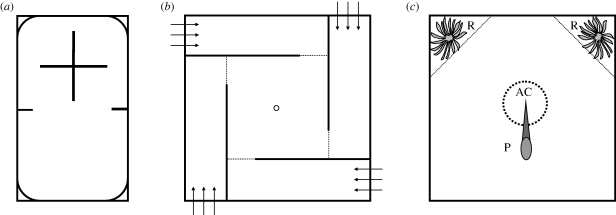
Figure 1.
Schematic figures presenting dorsal views of experimental areas used in the following experiments: (a) habitat preference and novel prey-foraging. Two small walls separate the barren area from the structural area. The structural area is divided with walls into four rooms. The liver item was placed in the middle of the barren area, (b) food search ability in a maze. The dotted lines are movable opaque PVC doors shielding entries to the four maze arms. The arrows represent the water inflow and the ring shows the water outflow, (c) escape response under a simulated predator attack. P represents the heron model, AC the acclimatization chamber (broken line) and the R's represent the refuge areas (delimited with dotted lines) with ‘water plants’. AC was withdrawn before the simulated attack from P. In all figures, the solid lines represent opaque PVC walls.

