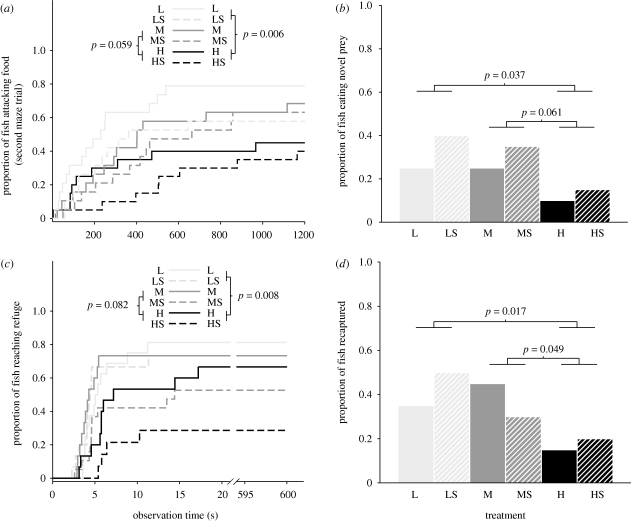
Figure 2.
Performance of brown trout reared under six different conditions: density treatments are indicated as natural density (L), approximately a third of conventional hatchery density (M) and conventional hatchery density (H), while the presence of structure is noted with S. (a) The proportion of fry attacking the food in the maze during the second trial as a function of observation time. (b) The proportion of parr eating a novel prey (i.e. maggot). (c) The proportion of parr reaching a refuge after a simulated predator attack as a function of observation time. (d) The proportion of parr recaptured after release in a natural stream (i.e. 35 days). All p-values indicate significance values for post hoc tests for the three-level categorical main effect density. In addition, the time to reach a refuge was longer for fish reared in structured tanks (p = 0.042).

