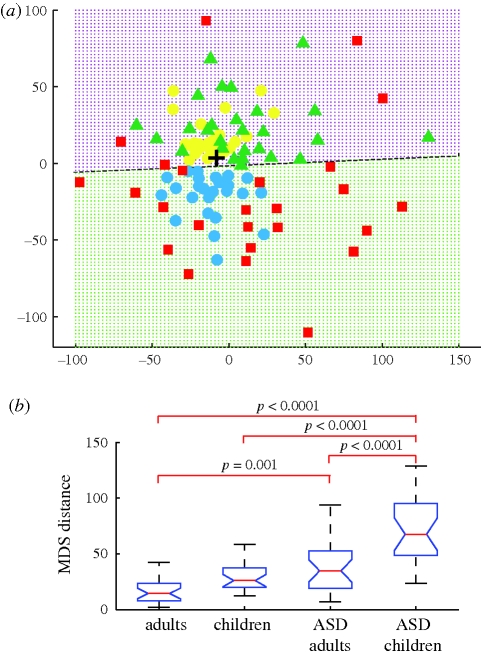
Figure 1.
Temporo-spatial gaze patterns quantified by the full trajectory analysis using MDS. (a) Distribution of gaze patterns in the MDS plane. Each symbol represents a full gaze trajectory (3728 gaze positions) from a single participant who belonged to the typical adult group (yellow circles), typical child group (light blue circles), adults with ASD group (green triangles) or children with ASD group (red squares). A black cross indicates the median position of the entire distribution. The broken line discriminates adults (purple dotted area) from children (green dotted area) and was calculated using a linear discriminant analysis. (b) Group comparison of the MDS distance measured from the cross in (a). On each box, the central mark is the median, the edges of the box are the 25th and 75th percentiles and the whiskers extend to the most extreme data points that were not considered outliers if they fell within 1.5 times the box length. Notches in each box show a 95% confidence interval of the median.

