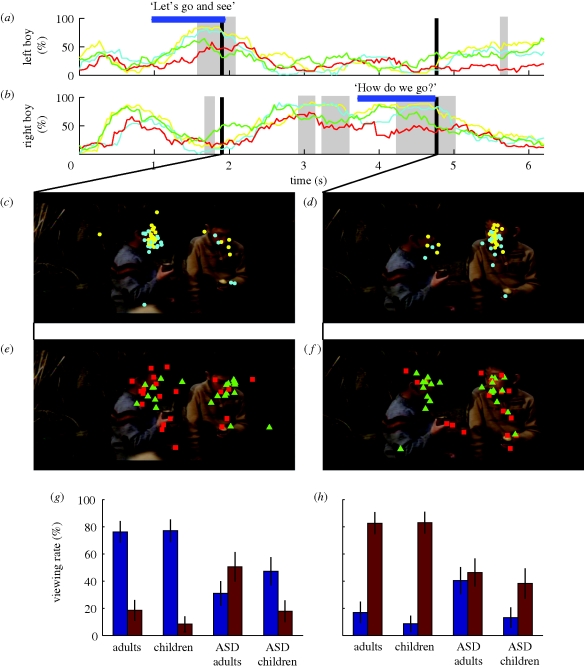
Figure 3.
Frame-by-frame analysis of clip 4, in which two boys took turns in a dialogue. (a,b) Temporal profiles of the viewing proportion for the (a) right and (b) left boy. (a,b) Yellow, adults; cyan, children; green, ASD adults; red, ASD children. Each horizontal bar indicates the period during which each boy delivered his dialogue (shown on the bar). Shaded areas show periods of significant difference in the viewing proportions between control and ASD groups (Wilcoxon rank-sum test: p < 0.01, uncorrected). (c–f) Gaze plots of typical adults (yellow circles) and children (light blue circles) at (c) 1.9 s and (d) 4.8 s, and of adults and children with ASD (green triangles and red squares) at (e) 1.9 s and (f) 4.8 s. (g,h) Group comparisons of face-viewing proportions for the right (brown) and left (dark blue) boys at (g) 1.9 s and (h) 4.8 s. Error bars show the s.e. of the mean.

