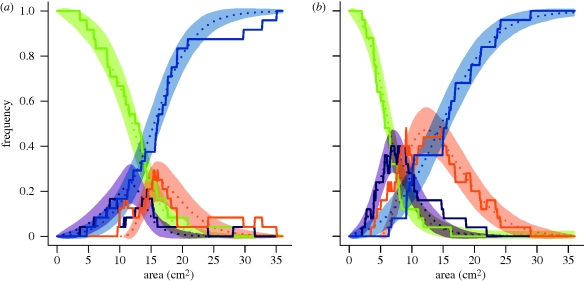
Figure 5.
Simulations reproduced well the dynamics according to area of each state fraction fi in each substrate. (a,b) Dot lines figure the mean fraction fi of experiments in state i, s.d. being figured in shades. Experimental dynamics are figured in full lines. (a) Simulations for granular substrate (24 replicates for each of 1000 simulations; η2 = 0.237, c2 = c3 = 12.74, η3 = 0.95, ηS = 0.313, cS = 15.46). (b) Simulations for cohesive substrate (25 replicates for each of 1000 simulations; η2 = 0.639, c2 = c3 = 5.97, η3 = 0.95, ηS = 0.239, cS = 14.61). Green, f1; purple, f2; orange, f3; blue, fS.

