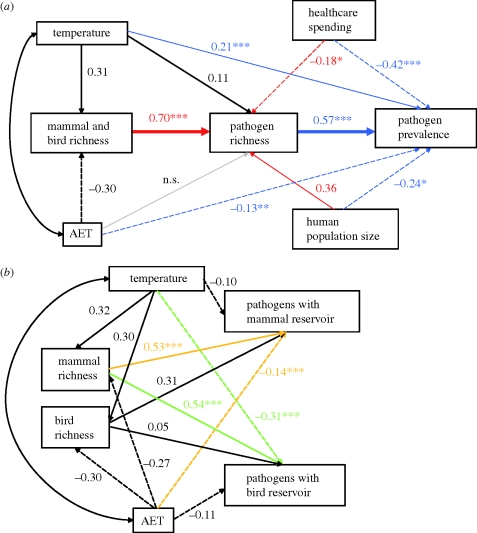
Figure 2.
SEM illustrating standardized coefficients for pathways among variables retained within the GLMs. Arrows indicate the direction of causality. Double-headed arrows indicate modelled covariance structure. (a) Coloured arrows represent the significant pathways from the GLMs of disease richness (red) and disease prevalence (blue). The pathway from AET to disease richness is not supported in the SEM or GLMs. Pathways in bold represent the SEM favoured by goodness-of-fit statistics (adjusted goodness-of-fit index = 0.44 and 0.98, BIC = 156.15 and −4.62, for the full model (all significant paths shown) and the favoured three-parameter model, respectively). (b) Coloured arrows represent the pathways retained in the minimum adequate models for the GLMs of richness of pathogens with mammal (orange) and bird (green) reservoirs. Values adjacent to paths represent standardized coefficients, asterisks indicate p-values from GLMs: ***p < 0.001, **p < 0.01, *p < 0.05.

