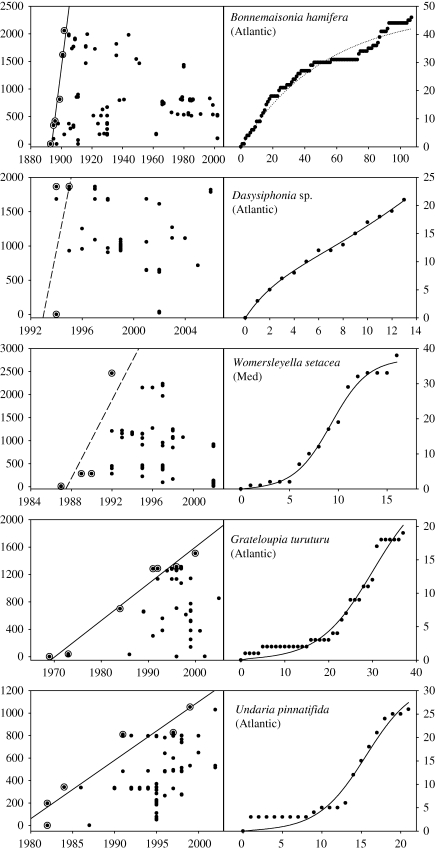
Figure 1.
Range expansion histories for five invasive seaweeds, chosen to illustrate the species with one or both of the potential spread regressions being significant. Plots on the left of each species pair show the distance (in km) from the point of origin. Solid lines represent significant linear regression estimates for the maximum rate of spread. Only points representing new maximum distances from the origin (circled points) are used in estimating the linear regression. Dashed lines indicate that the linear regression fit was not significant at the 0.005 level. Plots on the right of each species pair represent the accumulation of occupied grid squares. Solid curves represent an invasive spread: a significant fit for equation (2.2) (see text). A dotted line indicates that the accumulation of occupied sites can be described with a discovery model only (equation (2.1)). Horizontal axes are in years AD (left of each pair) or number of years since the first record (right of each pair).

