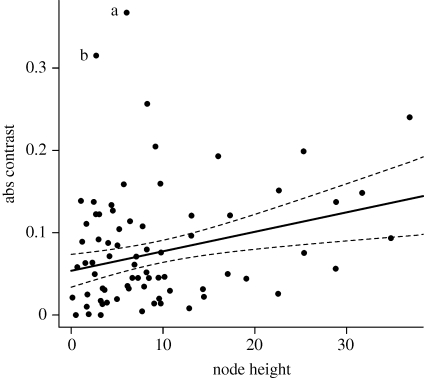
Figure 3.
Plot of absolute body size (abs) contrasts against node height for the node-height test. The two outliers are contrasts between (a) O. orca and O. brevirostris, and (b) Globicephala spp. and F. attenuata. The regression line and 95% confidence intervals are computed after removal of the outliers.

