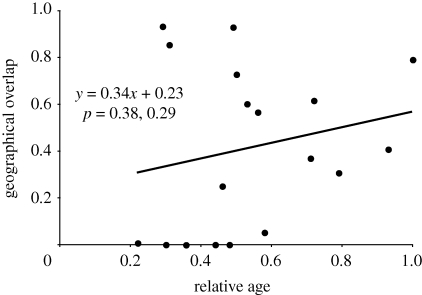
Figure 2.
Geographical overlap plotted as a function of relative age (ARC plot) for Neodiprion. Each point represents a node in the species tree in figure 1. Regression line and two-tailed p-values (slope, intercept) were calculated using PhyloCorrect as described in the text.

