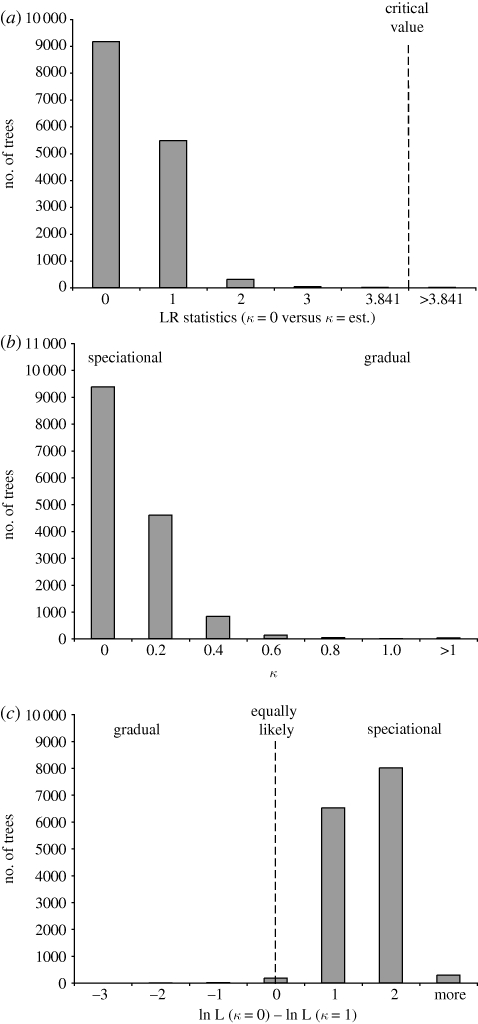
Figure 3.
Comparison of models of host-use evolution. Each graph is a frequency distribution of values estimated from 15 000 trees (post-burn-in trees obtained in a Bayesian analysis see text for details). (a) LRT statistics (LR = −2Δln L) for comparisons between models in which κ was estimated from the data (κ = est.) and κ was set to 0 (κ = 0; this corresponds to a speciational model of evolution). Nearly all comparisons failed to reject the simpler model (κ = 0). (b) Estimates of the parameter κ, which describes the relationship between branch length and the probability of character change. Values near 1 correspond to a gradual model; but most values clustered around 0, which corresponds to a speciational model. (c) Comparison of the likelihood of the data under a speciational model (κ = 0) to the likelihood of the data under a gradual model (κ = 1). Host-use data were almost always more probable under a speciational model of evolution.

