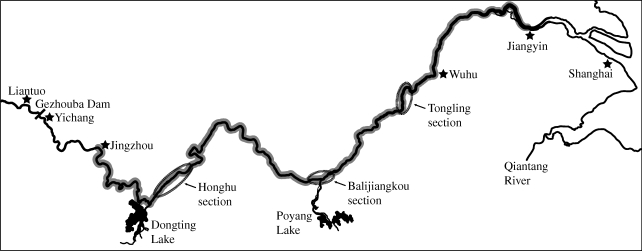
Figure 1.
Historical distribution of baiji in the middle–lower Yangtze region. Grey highlighted area indicates baiji distribution by the 1990s inferred from survey data (downstream end of this distribution reconstructed as either Wuhu or Jiangyin by different authors); sections ringed with broken line indicate three supposed remnant baiji ‘hotspot’ regions at beginning of 21st century; other named locations represent wider distribution of older (mid–late 20th century) baiji records in main Yangtze channel and neighbouring water bodies. See text for further details.

