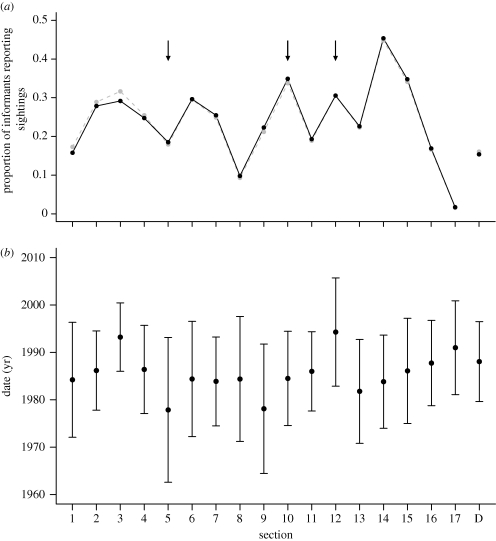
Figure 5.
Two indices of inferred historical variation in abundance of baiji across the seventeen 100 km Yangtze river sections from the Yichang section (1) downstream to the estuary (17), and in Dongting Lake (D). (a) Proportions of informants fishing per section who have reported baiji sightings from that section. Raw proportion data shown by black circles and solid line; age-standardized proportion data shown by grey circles and dashed line. Arrows indicate location of supposed remnant baiji ‘hotspots’ at the beginning of the 21st century. (b) Mean calendar date of historical baiji sightings recorded per section.

