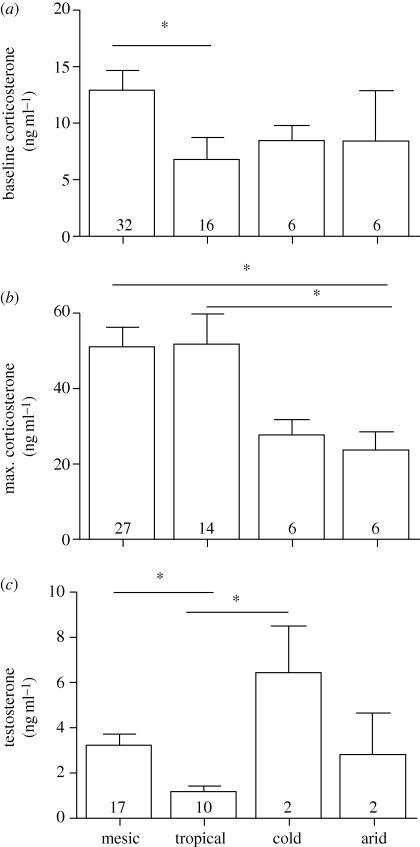
Figure 2.
Interspecific variations in concentrations (mean ± s.e.; ng ml−1) of (a) baseline corticosterone, (b) stress-induced corticosterone and (c) testosterone, in males from species breeding in different environments. Sample sizes are given in bars; significant differences between environments as derived from Tukey's HSD post hoc tests are indicated by horizontal lines and asterisks.

