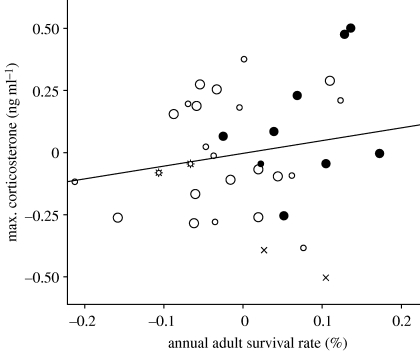
Figure 3.
Partial regression plot showing positive relationship between maximal corticosterone concentrations (MaxCort; ng ml−1) and survival rate (%). Data are displayed as unstandardized residuals after controlling for body mass in a linear regression model. The figure shows the largest dataset used in this study. Larger symbols denote own original dataset, smaller symbols refer to published data. Environments are coded as: open circles, mesic; filled circles, tropical; crosses, arid; stars, cold (arctic or alpine).

