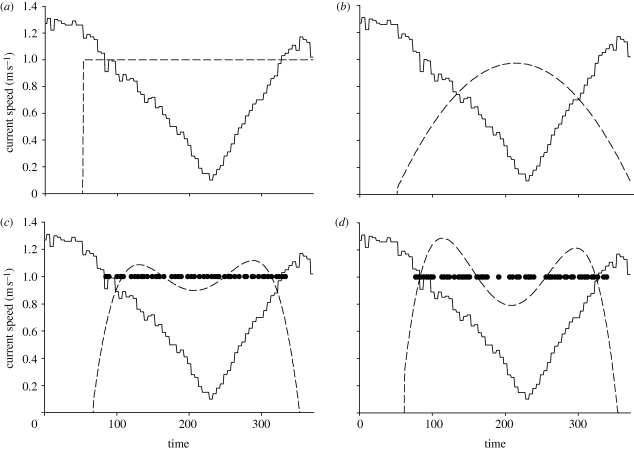
Figure 1.
Predicted allocation of foraging effort (dashed lines) by diving eiders over a strong spring tide current profile (solid lines) in relation to (a) time available, (b) the profitability of diving and (c) the dynamic model that considered the interaction between profitability, digestion and the tide cycle. (d) An example time series of observed foraging effort by a diving eider. Solid circles indicate an individual dive. Dashed lines in (c) and (d) are a graphical representation of foraging effort obtained using a moving average and curve fitting of the binomial (dive/rest) data (§3). As predicted by the dynamic model eiders, concentrated foraging effort at the beginning and end of the foraging period, and reduced effort in slack currents even though this was the most profitable time to dive. This allowed them to finish the foraging period with a full stomach and maximized net energy gain over the entire tide cycle.

