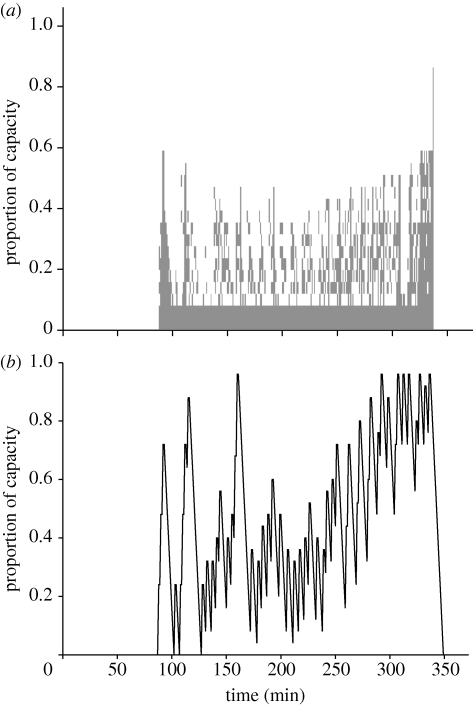
Figure 3.
(a) The decision state space generated by the dynamic model, indicating the optimal decision (white regions indicate resting, while grey regions indicate a decision to dive) as a function of the state of the stomach contents (proportion of capacity) and time across the tidal cycle. (b) Changes in the proportion of the stomach that is full, over the tidal cycle, as predicted by forward iteration through decision state space.

