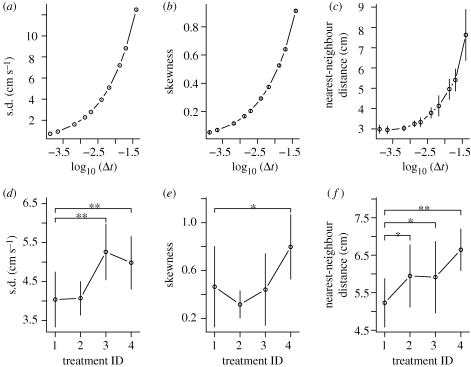
Figure 2.
Summary statistics for a shoal of eight fish for model simulations (a–c; five replicates) and empirical data (d–f; eight replicates) for varying Δt and different treatments, respectively. The model simulations are not fitted to the data. Error bars show 1 standard deviation from the mean; in (a) and (b), the error bars are smaller than the symbols. In (a) and (b) we show the mean of the standard deviations and skewness of normalized speed distributions (to account for varying group speeds). Both these statistics, as well as (c) the mean of the median nearest-neighbour distances, increase with increasing values of Δt (note the log scale on the x-axis, Δt, is measured in seconds). This trend is qualitatively replicated in the empirical data for decreasing perceived agitation levels (d–f). The effect of the treatments is analysed using a GLMM with predicting factors (categorical) treatment ID + sequential treatment order and random factor (categorical) replicate ID (see also electronic supplementary material). Significant differences between treatment 1 and other treatments are indicated by asterisks above the brackets (*p < 0.05, **p < 0.001).

